Pipeline & Revenue Analytics Dashboard Development for GTM Metrics
A Pipeline & Revenue Analytics Dashboard costs $1,000 – $2,200 at PINCLER and takes 10–18 days to build. CAC, pipeline velocity and conversion by channel in one live view your board will trust.
The price moves inside the $1,000 – $2,200 band based on how many of the features you need, the number of integrations, the number of user roles and whether existing data has to be migrated. That band is possible because AI coding tools write the first draft while senior engineers review every line, add automated tests and harden security. It covers this one workflow with standard integrations and never exceeds $2,500.
- Fixed price
- $1,000 – $2,200
- Delivery
- 10–18 days
- Built with
- Claude · GPT · Cursor · Claude Code · DeepSeek
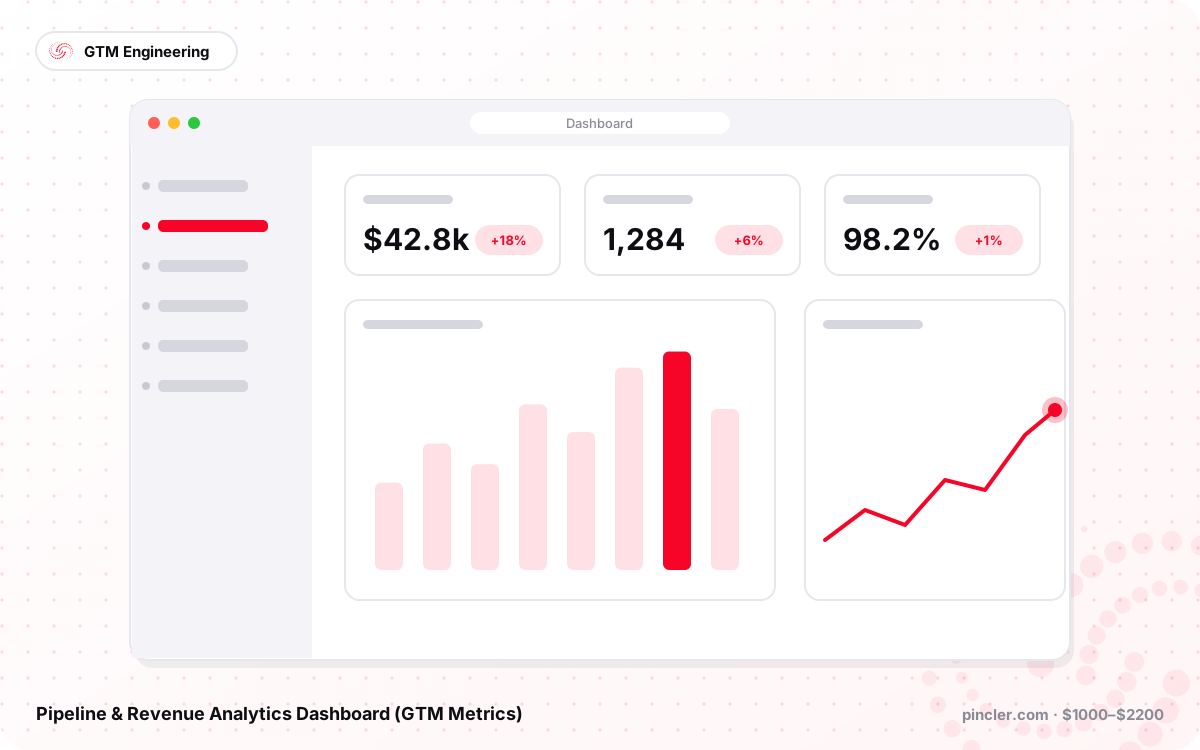
A GTM metrics dashboard that joins CRM, ad spend and billing data to show pipeline velocity, CAC, win rates and forecast by channel and rep. GTM engineering from $1,000 to $2,200.
The problem
Revenue numbers live in five places – the CRM, ad platforms, Stripe or Razorpay, spreadsheets and someone's memory. Monthly reporting takes days, every team quotes a different conversion rate, and board questions about CAC payback or pipeline coverage get answered with guesses.
What we build
We build a single analytics layer: scheduled pipelines pull from HubSpot, Zoho or Pipedrive, Google and Meta Ads, LinkedIn, Stripe or Razorpay and your product database into a warehouse; metric models define each number once; and a dashboard shows pipeline velocity, stage conversion, CAC and payback, win rates and forecast by channel, segment and rep. An AI assistant built on Claude answers plain-English questions about the numbers. Cursor and Claude Code generate the connectors and tests; DeepSeek handles low-cost historical backfills. Custom software development from $1,000 to $2,200 – never above $2,500.
Features included
- Connectors for CRM, ads, billing and product data
- Single metric definitions for the whole company
- Pipeline velocity and stage conversion
- CAC, payback and LTV by channel
- Forecast and pipeline coverage views
- Rep and team performance scorecards
- Ask-the-data AI assistant
- Scheduled Slack or email digests
- Row-level access for managers and reps
What you receive
- Data pipelines and warehouse in your cloud
- Metric models with documentation
- Dashboard with role-based access
- Metric glossary and handover video
- 30-day bug-fix warranty
How we build it
- Day 0: free 30-minute call to agree data sources, the metrics that matter and who sees what, followed by a written fixed quote
- Days 1–5: connectors for your CRM, ad platforms and Stripe or Razorpay go up and the historical backfill runs into your warehouse
- Days 6–10: metric models are defined once each – pipeline velocity, stage conversion, CAC and payback – with your team signing off every definition
- Days 11–14: dashboard views by channel, segment and rep are built with row-level access, plus scheduled Slack or email digests
- Days 15–18: the ask-the-data assistant is tuned on the modelled numbers, then glossary handover, training and the 30-day warranty
What each budget gets you
| Budget | Build | What changes |
|---|---|---|
| $1,000 | Core dashboard | Your CRM and one ad platform connected to a warehouse in your cloud, metric models for pipeline velocity and stage conversion, and the core dashboard views |
| $1,600 | Multi-source build | Adds Stripe or Razorpay billing data, CAC, payback and LTV by channel, rep and team scorecards, and scheduled Slack or email digests |
| $2,200 | Full GTM layer | Adds LinkedIn Ads and product-database connectors, forecast and pipeline-coverage views, row-level access rules and the ask-the-data AI assistant |
Ideal for
- SaaS founders and CROs
- Agencies reporting to clients
- D2C brands with paid acquisition
- Fintech and subscription businesses
- Portfolio companies reporting to investors
FAQ
Pipeline & Revenue Analytics Dashboard (GTM Metrics): common questions
What is a pipeline and revenue analytics dashboard?
A pipeline and revenue analytics dashboard joins your CRM, ad spend, billing and product data into one place and defines each metric once, so pipeline velocity, stage conversion, CAC and payback, win rates and forecast all come from the same source. Views break down by channel, segment and rep, with row-level access so managers and reps each see the right slice. An AI assistant answers plain-English questions about the numbers.
How much does a GTM analytics dashboard cost?
A pipeline and revenue analytics dashboard costs $1,000 to $2,200 at PINCLER as a fixed price. The number of data sources and how many custom metrics need defining are the main drivers. Warehouse and cloud costs are billed to your own account, and our quote never exceeds $2,500.
How long does it take to build?
A pipeline and revenue analytics dashboard takes 10 to 18 days to build. Connectors and the historical backfill come first, then the metric models, which is where the real work sits, because agreeing what a qualified lead means usually takes longer than coding it. Dashboard views and access rules come last.
Which systems can it connect to?
Connectors cover HubSpot, Zoho and Pipedrive, Google and Meta Ads, LinkedIn, Stripe and Razorpay, and your own product database. Data lands in PostgreSQL, BigQuery or Supabase, depending on what you already run. Slack and email digests deliver the key numbers on a schedule so nobody has to log in.
Can we use our existing BI tool?
Yes. We can feed Metabase, Looker Studio or Power BI from the same metric models, or build a custom Next.js dashboard if you want the ask-the-data assistant and row-level access. The assistant answers plain-English questions such as which channel had the best CAC payback last quarter, using only the modelled numbers. Either way, the metric definitions live in one place rather than being redefined in every report.
Where does the data live?
Your data lives in your own warehouse, whether Postgres, BigQuery or Supabase, with credentials you control, and we keep no copy after handover. Pipelines, metric models and the dashboard code sit in your repository. The metric glossary is written down so the definitions survive staff changes.
Do we need this, or would CRM reports do?
HubSpot, Zoho and Pipedrive reporting is fine while every number you care about lives in the CRM. This build is for when revenue truth is spread across the CRM, ad platforms, Stripe or Razorpay and a product database, and each team quotes a different conversion rate. If one analyst with a spreadsheet already produces numbers everyone trusts, keep them and spend the money elsewhere.
Who is this for, and when is it not worth it?
A pipeline and revenue analytics dashboard is for SaaS founders, CROs, agencies reporting to clients and companies answering to investors, where a board question about CAC payback or pipeline coverage currently gets a guess. It is premature if your CRM data is inconsistent, because a dashboard over bad data produces confident wrong answers and the hygiene work has to come first. It also needs someone who will own the metric definitions after handover.
Related
Similar projects within the same budget
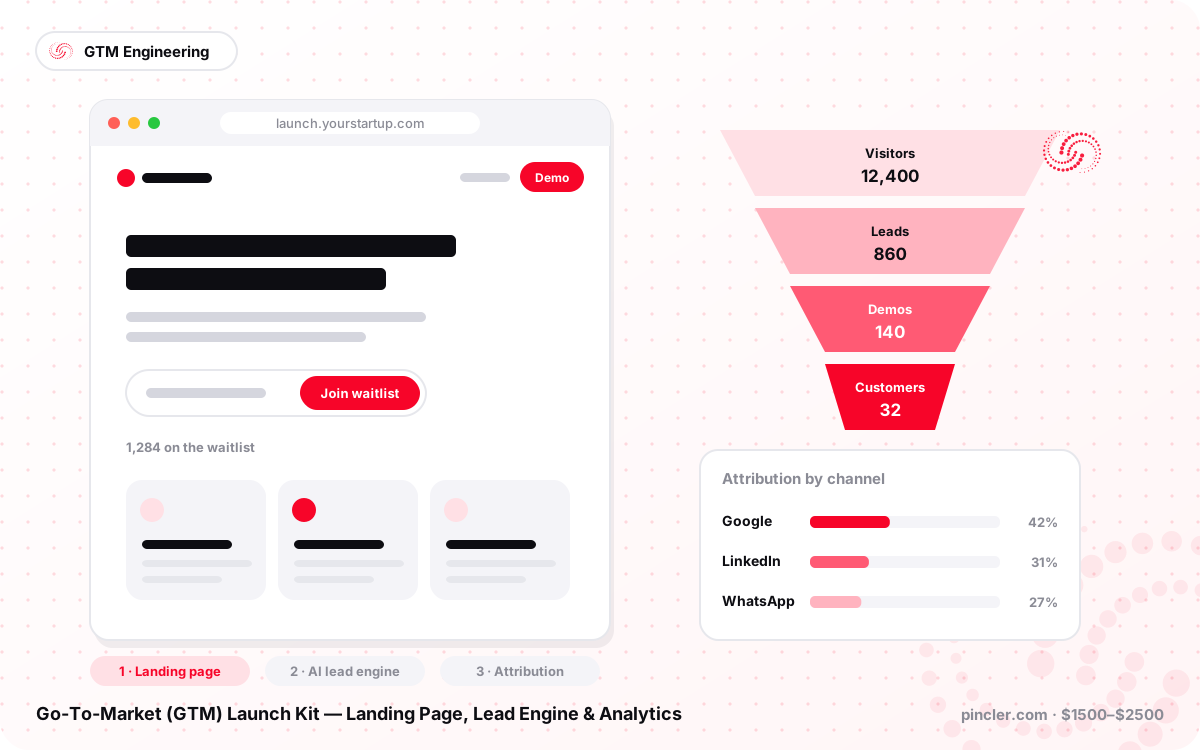
Go-To-Market (GTM) Launch Kit — Landing Page, Lead Engine & Analytics
Fixed-price go-to-market kit: SEO landing page with lead capture, AI lead engine for email, WhatsApp and LinkedIn follow-ups, and an attribution dashboard. $1,500 – $2,500 in 14–21 days.
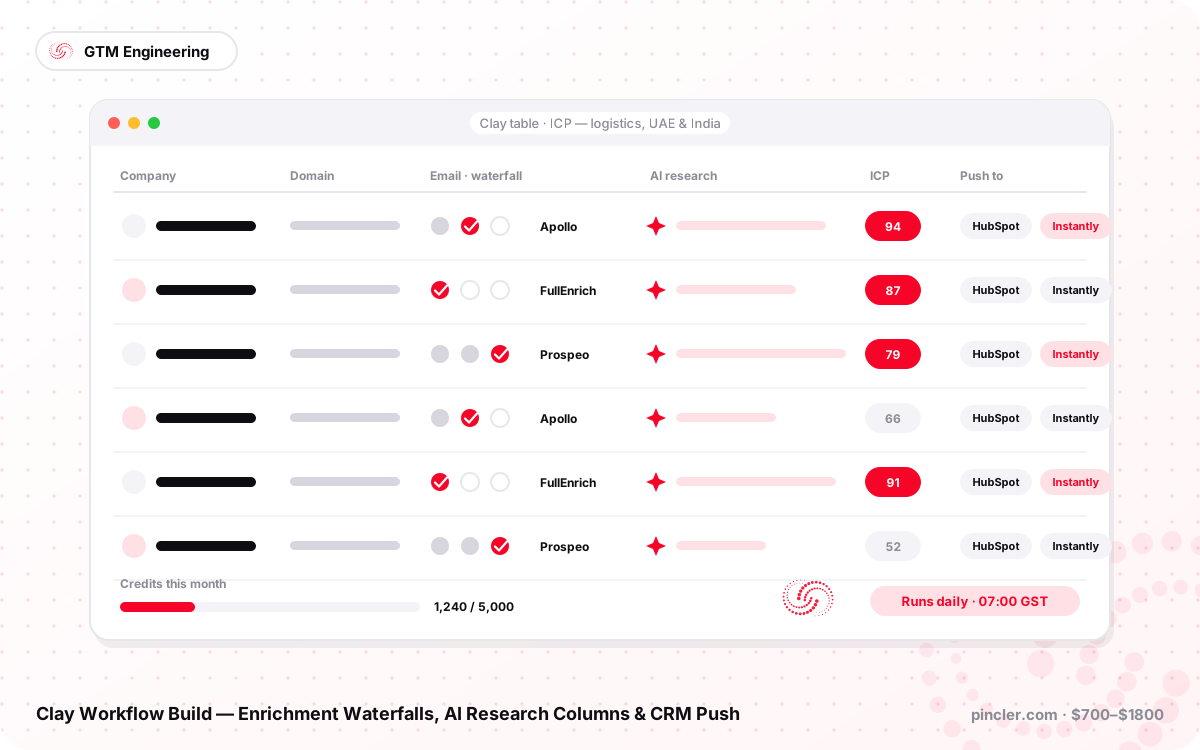
Clay Workflow Build — Enrichment Waterfalls, AI Research Columns & CRM Push
Expert Clay build-out: ICP sourcing, credit-efficient enrichment waterfalls, Claude and GPT research columns and pushes to HubSpot, Instantly or Smartlead. From $700 to $1,800.
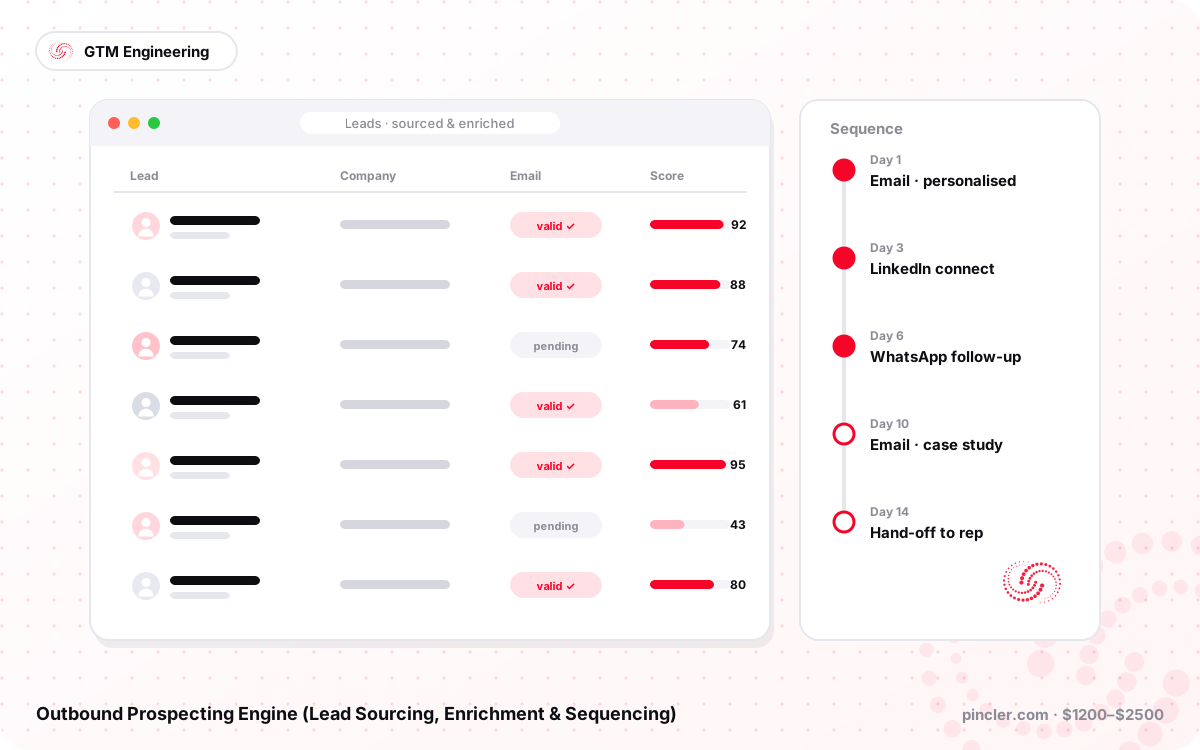
Outbound Prospecting Engine (Lead Sourcing, Enrichment & Sequencing)
Outbound engine that sources leads from LinkedIn, Apollo and Google Maps, enriches and scores them with AI, and feeds personalised sequences. GTM engineering from $1,200 to $2,500.