KPI & Business Analytics Dashboard Development
A KPI & Business Analytics Dashboard costs $1,000 – $2,200 at PINCLER and takes 10–18 days to build. See revenue, sales and operations KPIs live instead of waiting for Friday's spreadsheet.
The price moves inside the $1,000 – $2,200 band based on how many of the features you need, the integrations required, the number of user roles and whether existing data has to be migrated. That band is possible because AI coding tools write the first draft while senior engineers review every line, add automated tests and harden security. It covers this one workflow with standard integrations and never exceeds $2,500.
- Fixed price
- $1,000 – $2,200
- Delivery
- 10–18 days
- Built with
- Claude · Cursor · GPT · v0
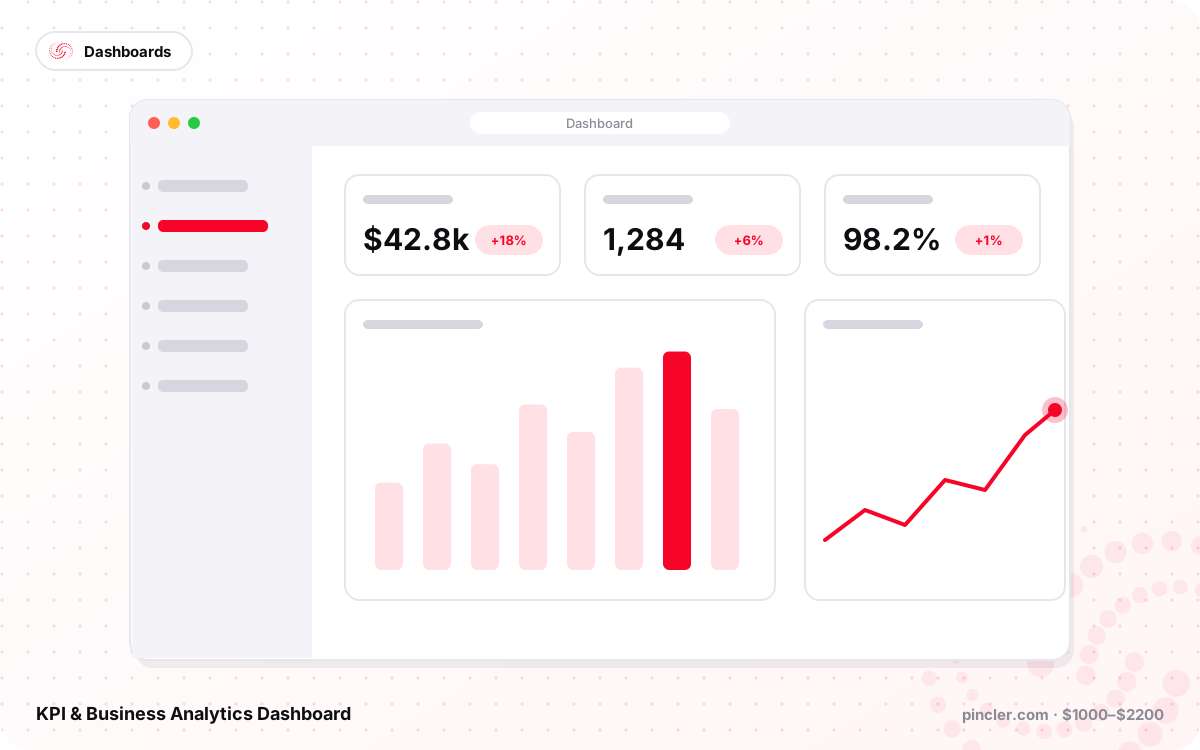
A KPI and business analytics dashboard that pulls live numbers from your sales, finance and operations tools. Custom dashboard development from $1,000 to $2,200 in 10 to 18 days.
The problem
Owners and managers in the UAE and India still wait for someone to export reports, paste them into Excel and email a deck at month end. By the time the numbers arrive they are stale, every department calculates margin differently, and nobody trusts the totals. Decisions about stock, hiring and ad spend get made on gut feel, and problems such as a drop in repeat orders are spotted weeks late.
What we build
We build a KPI dashboard that connects to your POS, CRM, accounting software, ad accounts and databases, syncs on a schedule into a PostgreSQL warehouse and presents the numbers as clear charts with targets, trends and drill-downs. Claude helps us write and check the SQL transformations, v0 produces the chart layouts, and Cursor with GPT scaffolds the connectors and tests, so a dashboard that used to take two months ships in under three weeks. We review every metric definition with you, then hand over the source code at a fixed price that never exceeds $2,500.
Features included
- Connectors for Zoho, HubSpot, Shopify, Tally and QuickBooks
- Revenue, margin, cash and pipeline KPIs with targets
- Daily automatic data refresh
- Drill-down from company to branch to product
- Email or WhatsApp alerts when a KPI slips
- Role-based views for owners, managers and staff
- Export any chart to PDF or Excel
- Mobile-friendly layout for checking on the go
What you receive
- Source code and SQL models in your repository
- Dashboard deployed on Vercel with your domain
- Metric definitions document agreed with you
- Walkthrough video for managers
- 30-day warranty and metric tuning
How we build it
- Day 0: free 30-minute call to agree the KPIs, data sources and targets, followed by a written fixed quote
- Days 1–4: we connect your POS, CRM, accounting and ad accounts and set up the PostgreSQL warehouse
- Days 5–9: SQL transformations and metric definitions are built and reviewed with you line by line
- Days 10–14: charts, drill-downs and alerts go live to managers and we reconcile numbers against your existing reports
- Days 15–18: full launch with role-based views, walkthrough video and the 30-day warranty begins
What each budget gets you
| Budget | Build | What changes |
|---|---|---|
| $1,000 | Two sources | Two data connectors such as Shopify and QuickBooks, ten KPIs with targets, daily refresh and a dashboard on your Vercel domain |
| $1,600 | Multi-source | Adds two more connectors, drill-down from company to branch to product, role-based views and email alerts when a KPI slips |
| $2,200 | Full analytics suite | Adds WhatsApp alerts, PDF and Excel export on every chart, custom metric formulas agreed with your finance team and a mobile-friendly layout |
Ideal for
- Retail chains
- Restaurant groups
- Distributors and wholesalers
- Agencies
- Startup founders
- Finance teams
FAQ
KPI & Business Analytics Dashboard: common questions
What does a KPI dashboard cost and how long does it take?
Typically $1,000 to $2,200 depending on the number of data sources and metrics, delivered in 10 to 18 days. The price is fixed up-front and never exceeds $2,500.
Where does our business data live?
In a PostgreSQL or Supabase database inside your own cloud account. We never copy your data to our servers, and you can revoke our access the day the project ends.
Can it replace Power BI or Tableau?
For most small and mid-sized teams, yes. You get exactly the metrics you need with no per-seat licence fees, and it is simpler for staff than a general-purpose BI tool.
Related
Similar projects within the same budget
Admin Dashboard & Back-Office Panel
A custom admin dashboard and back-office panel to manage users, orders, content and settings in one place. Custom software development from $800 to $2,000 in 8 to 16 days.
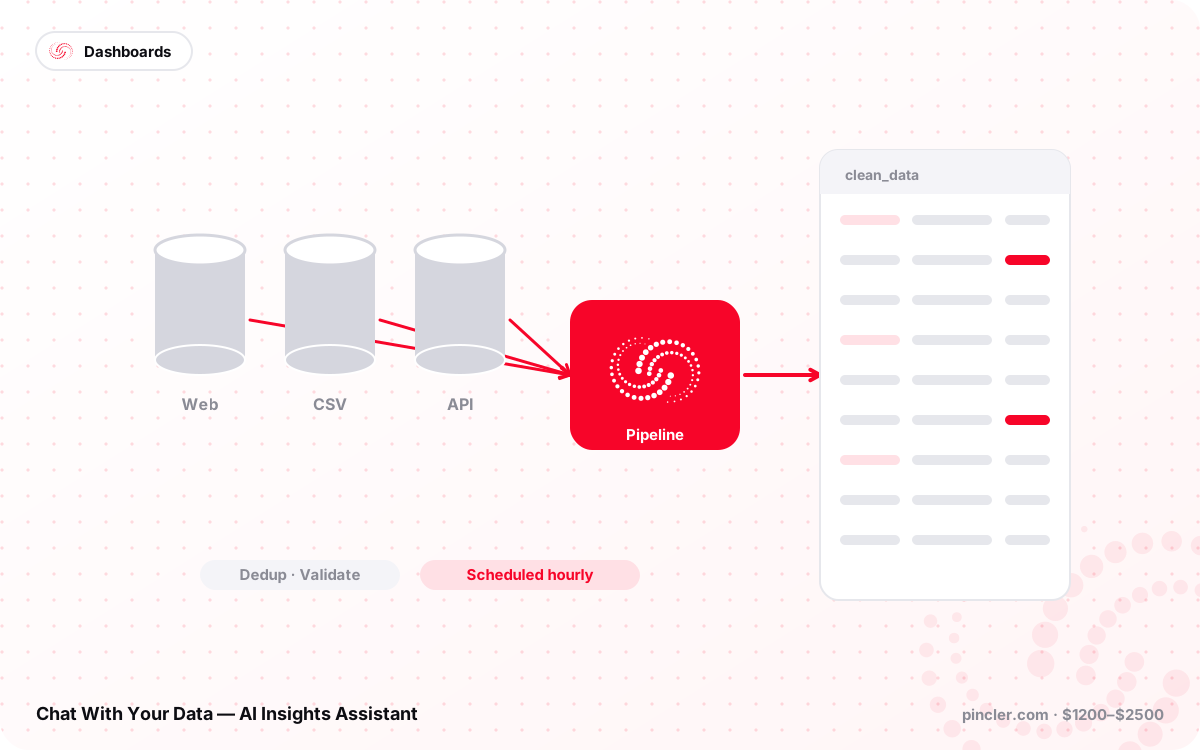
Chat With Your Data — AI Insights Assistant
An AI insights assistant that lets your team question your database in plain English, Arabic or Hindi and get charts back. Custom AI development from $1,200 to $2,500 in 12 to 20 days.
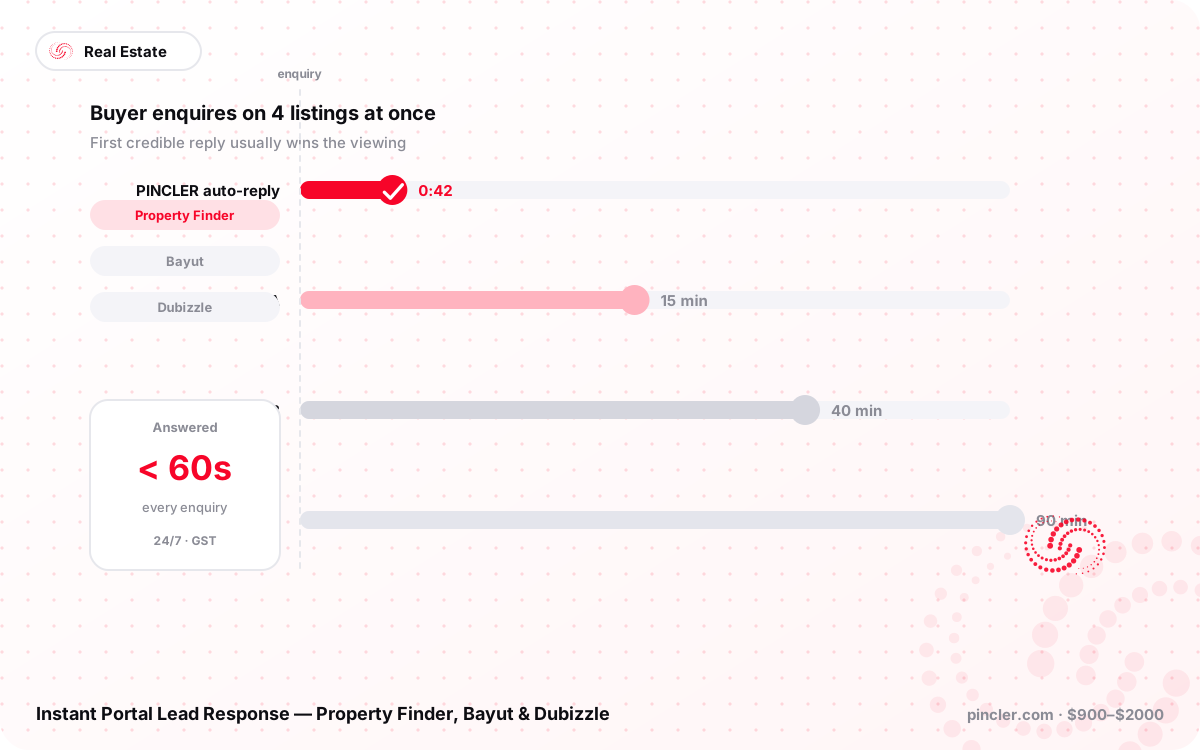
Instant Portal Lead Response — Property Finder, Bayut & Dubizzle
Custom software development that replies to every portal lead within a minute by WhatsApp, SMS and email, quoting the exact listing. From $900 to $2,000, live in two weeks.